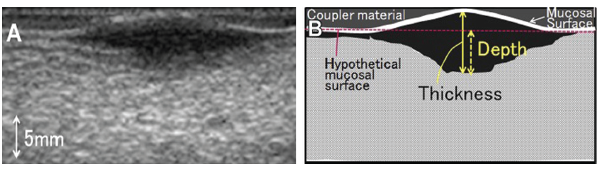
Example of sonographic visualization of oral tongue squamous cell carcinoma. Tumor is identified as a hypoechoic area on ultrasound. (B) Schematic representation of the difference between TT and DOI.
© Reprinted from Oral Surg Oral Med Oral Pathol Oral Radiol, 119(2):246–253, Copyright 2015, with permission from Elsevier.