Spending growth has slowed, and docs are increasing practice volume and intensity to keep up
Explore This Issue
April 2006If you are a health policy prognosticator you would be on solid ground if you had said that health-care costs rose in 2004, the last year for which complete data are available. But if you had really polished your crystal ball, you’d see that the upward trend has actually slowed for the second straight year, according to the National Health Statistics Group, Office of the Actuary, Centers for Medicare and Medicaid Service’s annual report of how the US spent nearly $2 trillion on health care in 2004.
Overall, the health-care spending report, published in the January/February 2006 issue of the journal Health Affairs, showed a modest deceleration in health-care spending in 2004. Although spending rose 7.9% to $1.9 trillion, the increase was lower than the 8.2 growth rate that the industry posted in 2003 and the 9.1% rise in 2002. In 2004 per capita spending amounted to $6280 per person, and, in aggregate, health care consumed 16% of America’s gross domestic product.

How the health-care spending pie is consumed has altered over the last several years. Hospitals’ and physicians’ shares grew the most, with hospitals consuming 38% of the resources in 2004 versus 28% in 2000 through 2002. Physicians’ share of health-care dollars jumped from 25% in 2000 through 2002 to 29% in 2004.
Health and Human Services Secretary Michael Leavitt suggested that while the growth rate of health-care spending is declining, the cost of health-care continues to be a concern for government, business, individuals, and families. We must build on steps already taken-the new Medicare prescription drug benefit, advancing health information technology, and encouraging a prevention-oriented society-to find innovative, market-based ways to control costs, said Leavitt.
Compared to 2000 through 2002, the pace of medical spending has slowed for both public and private payers. But the effect on various parts of the system has been uneven. Physician services actually had the second highest spending growth at 9.0%, while home health agency spending grew by 11.1%.
The Findings at a Glance
- Total 2004 health-care spending – $1.9 trillion
- Spending rose 7.9% in 2004 vs. 8.2 % in 2003
- Per capita health-care spending – $6280
- Prescription drug spending grew 8.2%, the first year of single-digit growth in a decade
- Spending for physician services grew 9% in 2004, versus 8.6% in 2003
- Medicare spending rebounded with small payment increases for physicians, capitated health plans, and rural providers
Source: Health Affairs 2006;25(1): 186-195.
Physicians and Prescriptions
Spending for doctors’ services jumped to $399.9 billion in 2004, a 9% increase versus 8.6% in 2003. Physician services accounted for a 29% share of total growth of professional services, up from an average of 25% in 2000 through 2002. Public spending on physicians’ services went up, from 8.9% in 2003 to 9.9% in 2004. Medicare’s portion of the bill rose 11.1%, an increase from 8.8% in 2003. According to CMS analysts, since Medicare’s physician fee schedule in 2004 was similar to that of 2003, the growth in spending resulted from increasing volume and intensity of services rather than higher reimbursement.
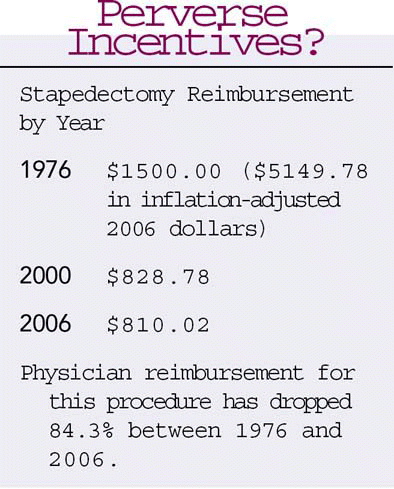
Gerard Gianoli, MD, a Baton Rouge, La. Clinical Associate Professor of Pediatrics and Otolaryngology-Head and Neck Surgery at Tulane University School of Medicine and an ENToday board member, noted that the National Health Care Spending 2004 report contained no surprises for him, since physician reimbursements have been virtually flat for over a decade. Perhaps I’m cynical, said Dr. Gianoli, but the report reflects a big distortion of the supply and demand curve. Since Medicare and other insurance plans fix physician reimbursement, doctors can’t charge more money. And since there’s only so much time in a day, instead of seeing ten patients they’ll see twenty to maintain income levels. That’s why volume is up.
Dr. Gianoli also pointed out that patients with a minimal $5 co-pay or even less for an office visit have no financial incentive to handle minor medical issues on their own. That creates virtually unlimited demand for physician services, leading to higher volumes of patient visits. As for the apparent increase of intensity of services rendered, he said that electronic medical records enable medical offices to automatically upcode, thereby taking advantage of higher reimbursement rates. The reality is that intensity is probably down because we can do less in a 10 minute than a 30 minute patient visit, he added. The system is so out of whack that physicians are not rewarded for performing optimal treatment (see box, left).
Good news for the US economy as a whole, prescription drug spending continued to decelerate in 2004, increasing only 8.2% versus 10.2% in 2003-the first single-digit growth in pharmacy spending in 10 years. A number of factors including rapid growth in prescribing lower-priced generic drugs, increased use of OTC anti-ulcerants and antihistamines, a move toward more mail order dispensing (up 13.6% versus 2% growth in retail pharmacy), and more refined tiered co-pay systems accounted for the slowdown.
Since Medicare and other insurance plans fix physician reimbursement, doctors can’t charge more money. And since there’s only so much time in a day, instead of seeing ten patients they’ll see twenty to maintain income levels. – Gerard Gianoli, MD
In addition, health plans increased incentives for consumers to use both generics and OTC drugs-lower co-pays for retail and mail order pharmacy, coupons, and not covering certain brand-name drugs. Physicians should weigh the impact of these measures on patients’ pocketbooks; generic co-pays, while smaller in absolute cost than those for brand name drugs, sometimes result in higher out-of-pocket costs. In contrast to an overall decrease in health spending growth, out-of-pocket drug spending outpaced private health insurance spending growth in 2003 and 2004 (9.4% and 7.1%, respectively.)
Institutions
Payments to home health agencies rose more rapidly than any other institutional category, 11.1% in 2003 and 13.3% in 2004, to $43.2 billion. Medicare spending for home care jumped 19.3% in 2004, impelled mostly by rapid growth of hospice care delivered at home.
Spending rose for hospitals at a higher rate than the overall 7.9% for all health-care spending. Hospital spending of $570.8 billion accounted for about one-third of total costs in 2004. It rose 9.5% for private insurers and 9.9 % for Medicaid. High compensation costs, fueled by higher wages for nurses and higher professional liability costs, were the key drivers of this uptick. Hospital volume was flat considering the growing US population, with growth in admissions and outpatient visits of only 1.2%, down from 2.4% between 2001 and 2003.
As for payments to skilled nursing facilities, they rose 4.3% in 2004, to $115 billion, with Medicaid accounting for 44% of the spending. With the federal government restricting what measures states can take to finance their share of Medicaid costs for skilled nursing facilities, Medicaid spending for this sector went up only 3% in 2004, compared to a 5.3% increase in 2003.
While 2004 spending on health care grew more slowly than in the three previous years, authors of the Health Affairs article say that new medical technology, rising prices, and growing utilization will maintain upward momentum. Payers will continue to look for efficiencies and better outcomes-on tighter budgets.
Find Out More
©2006 The Triological Society
Leave a Reply