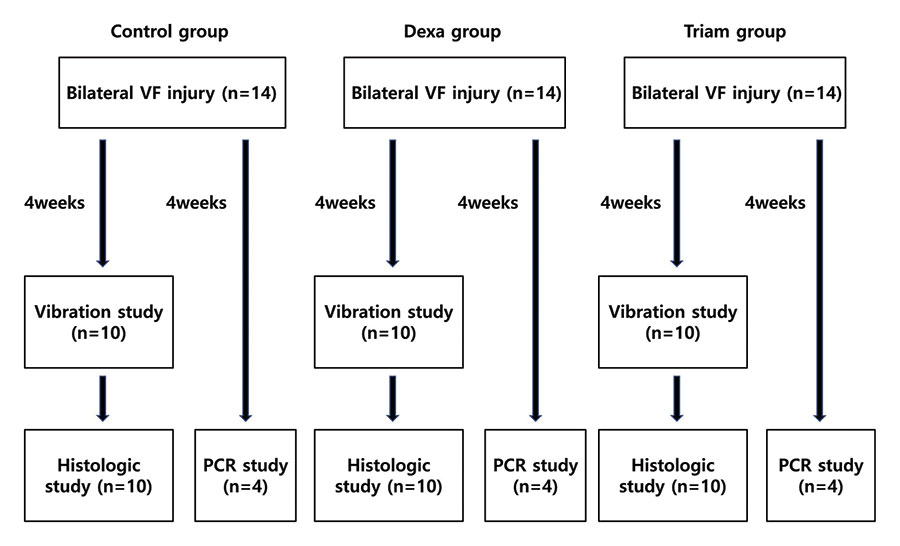
Figure 1: Experimental paradigm for the animal model. PCR = polymerase chain reaction; VF = vocal fold.
Surgical Procedures
Explore This Issue
May 2025All 42 rabbits were locally anesthetized prior to the experiment. They received intramuscular injections of 1 mL/kg Rompun (xylazine hydrochloride; Bayer Korea, Seoul, Korea) and ketamine (ketamine hydrochloride; Yuhan Ketamine 50 Injection; Yuhan Co., Korea). Following anesthesia, a long nasal speculum was inserted through the oral cavity, connected to a telescope (30°, 2.7 mm × 30 cm; Karl Storz Co., Tuttlingen, Germany), providing an unobstructed view of the vocal folds.
The lamina propria layer of both vocal folds was subjected to injury using a 532-nm diode laser (Quanta D8 532 diode lasers; Quanta System, Solbiate Olona, Italy; 600 µm diameter). The laser was set to 8 W pulses, with a pulse width of 50 ms and 2 pulses/s. The laser was applied from a fiber tip positioned 1-2 mm from the vocal fold, inducing a superficial injury. Each side of the vocal folds received a total of 20 joules of energy.
The treatment groups, Dexa and Triam, subsequently received 0.1-mL corticosteroid injections (either dexamethasone 5 mg/1 mL or triamcinolone 40 mg/1 mL) into the superficial layer of the lamina propria. The control group did not receive any additional treatment. Following surgery, all rabbits were moved to a recovery table and monitored for one to two hours, with 2 L/h of oxygen administered via nasal prong. All rabbits were euthanized four weeks following the surgery.
High-Speed Vocal Fold Vibration Test
Supraglottal structures, including the false vocal folds, epiglottis, and aryepiglottic folds, were removed from 10 harvested larynges. To ensure proper arytenoid approximation, the vocal folds were medialized using suture adduction of the arytenoids with 5–0 nylon sutures. A small, custom-fitted pipette tip was used for each trachea to prevent air leakage, thereby directing air through a tube to the glottis to seal the trachea. Oxygen from a compressed gas tank was delivered via a flow controller (Flow Gentle+; Koike Medical, Tokyo, Japan). The larynges were irrigated with phosphate-buffered saline to maintain moisture during the tests. After confirming the flow rate at which consistent and audible phonation with a stable mucosal wave was obtained for the vocal folds in all groups, all experiments were conducted at this same flow rate.
The maximum amplitude difference (MAD) was measured, reflecting the difference in mucosal wave amplitude. High-speed video endoscopy was performed using a Mega Speed X9 PRO Camera (Mega Speed Corporation, Mississauga, Canada) at a frame rate of 5,000 frames per second, allowing for detailed analysis of the vocal fold vibrations. The high-speed recordings were processed using TEMA 4.2 software (Image Systems Motion Analyses, Linköping, Sweden) to derive and analyze the vibrational amplitudes. Using a steel ruler positioned in front of the larynx and a high-precision calibrated grid displayed on the screen, the highest and lowest amplitudes of each vocal fold vibration cycle were measured and compared across groups. Measurements were taken from an imaginary line connecting the anterior commissure and the midlines of both arytenoids to the mid-membranous vocal fold region of the highest amplitude. All images were resized to equalize the anterior-to-posterior lengths of the vocal folds. The averages of the highest and lowest amplitudes from both vocal folds over approximately 100 cycles were compared among the three groups.
Histological Study
Ten larynges from each group after the vibration study were embedded in paraffin and sectioned coronally at a thickness of 6 µm. Slides including the middle regions of the membranous vocal folds underwent histological analysis. Staining was performed using hematoxylin and eosin and Masson’s trichrome to quantify the pixels of vocal fold and collagen density (CD) in each group.
The vocal folds were examined at a magnification of 20× using a Nikon Eclipse 80i microscope (Nikon Corporation, Tokyo, Japan) equipped with a Jenoptik color camera (ProgRes C10 Plus, Jena, Germany). ImageJ software (version 1.43u; National Institutes of Health, Bethesda, Md., USA) was used to calculate the total number of stained vocal fold regions. A single-blinded pathologist determined the CD ratio, dividing the number of CD pixels by the total number of pixels in the entire vocal fold, to minimize measurement bias.
The concept of cross-sectional area (CSA) was introduced as an indirect method to assess the volumes of the vocal folds. The mean CSA was determined by counting pixels corresponding to the true vocal fold in the slides, offering a partial representation of changes in vocal fold volume.
Real-Time PCR of ECM Genes
Eight vocal fold samples from four larynges in each group were analyzed using real-time PCR to assess gene expression in the ECM. After dissection, specimens were immediately placed in RNAlater Stabilization Solution and kept on ice until transfer. After 24-hour storage at 4°C, specimens were moved to −20°C until further processing. Homogenization was performed with the Bead Ruptor Elite (Omni International), ensuring a temperature below 4°C using liquid nitrogen. Total RNA was extracted using TRIzol reagent (Invitrogen, Carlsbad, Calif., USA), and reverse transcription was performed using ReverTra Ace qPCR RT master mix with gDNA Remover (Toyobo, Osaka, Japan). For the reaction, 1-µg total RNA was utilized in a 10 µL reaction volume, and the generated cDNA was diluted with diethyl pyrocarbonate in 1:5 ratio (cDNA: DEPC). qPCR was done with SYBR Green real-time PCR master mix (Toyobo) on a StepOnePlus real-time PCR system (Applied Biosystems, Foster City, Calif.) (Table I). The qPCR machine was set up with three steps: denaturation at 95°C, primer annealing at 60°C, and extension at 72°C. The reaction was run for 40 cycles and followed by melt curve analysis to ensure single-target amplification. Briefly, all the products generated during the amplification reaction were melted at 95°C, then annealed at 55°C, and subjected to a gradual increase in temperature to 95°C. Gene expression levels were normalized against the housekeeping gene glyceraldehyde-3-phosphate dehydrogenase (GAPDH). The ∆CT values were calculated using the formula: CT target – CT GAPDH. Relative fold changes were determined using the 2−∆∆CT method.
Statistical Analysis
Statistical analyses were conducted using SPSS (version 18.0; IBM, Armonk, N.Y., USA), with the significance threshold set at p < 0.05. Means and standard deviations were calculated for each group. The Kruskal–Wallis test was used to compare scores across treatment groups and controls. Where statistical significance was observed, post hoc analysis with the Bonferroni multiple comparison test was employed to identify significant differences between pairs of values, with p-values adjusted to account for multiple comparisons. For the CSA analysis, relative normalization was applied to the treatment group data using the mean and standard deviation of the control group data to account for heterogeneity in laryngeal anatomy among rabbits.
RESULTS
High-Speed Vocal Fold Vibration Test
Leave a Reply