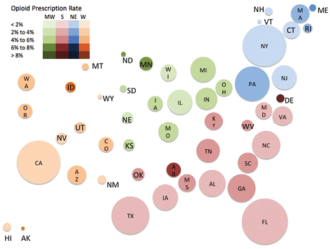
Regional variation in opioid prescribing patterns among otolaryngologists. Area of each circle is proportional to the number of total prescriptions to Medicare Part D beneficiaries (all medications), whereas the color intensity represents the proportion of prescriptions that are for opioids (key shown at inset). Southern (S) states are represented by red, Northeastern (NE) states are represented by blue, Midwestern (MW) states are represented by green, and Western (W) states are represented by orange.
Credit: © 2018 The American Laryngological, Rhinological and Otological Society, Inc.